1 Prometheus简介
Prometheus是一个开源监控系统,前身是SoundCloud的警告工具包。从2012年开始,许多公司和组织开始使用Prometheus。该项目的开发人员和用户社区非常活跃,越来越多的开发人员和用户参与到该项目中。目前是一个独立的开源项目,且不依赖任何公司。为了强调这点和明确该项目治理结构,Prometheus在2016年继Kurberntes之后,加入了Cloud Native Computing Foundation(云原生基金会)。
官网:https://prometheus.io/1.1 特性
1.多维 数据模型(时序由 metric 名字和 k/v 的 labels 构成)。
2.灵活的查询语句(PromQL)。
3.无依赖存储,支持 local 和 remote 不同模型。
4.采用 http 协议,使用 pull 模式,拉取数据,简单易懂。
5.监控目标,可以采用服务发现或静态配置的方式。
6.支持多种统计数据模型,图形化友好。
1.2 架构图
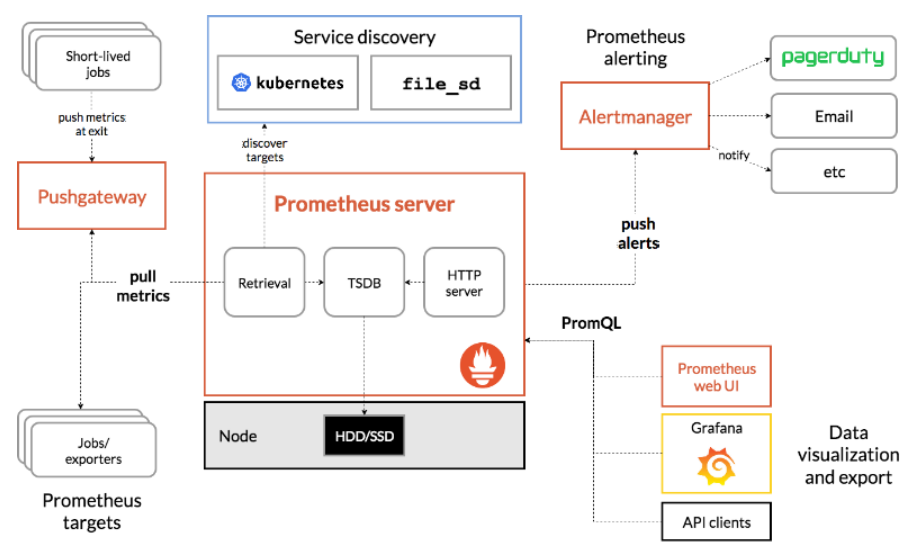
从架构图看,Prometheus 的主要模块包含:prometheus server、exporters、pushgateway、PromQL、Alertmanager、WebUI等。
1.prometheus server: 定期从静态配置的 targets 或者服务发现(主要是DNS、consul、k8s、mesos等)的 targets 拉取数据。
2.exporters:负责向prometheus server做数据汇报的程序系统。而不同的数据汇报由不同的exporters实现,比如监控主机有node-exporters,mysql有MySQL server exporter。
3.pushgateway:主要使用场景是Prometheus 采用 pull 模式,可能由于不在一个子网或者防火墙原因,导致 Prometheus 无法直接拉取各个 target 数据。在监控业务数据的时候,需要将不同数据汇总, 由 Prometheus 统一收集。
4.PromQL:实现统计数据查询
5.Alertmanager:实现prometheus的告警功能。
6.webui:主要通过grafana来实现webui展示。
1.3 什么是指标(metrics)?
用外行话说,指标(metrics)是数字度量。时间序列意味着随着时间的推移记录变化。用户想要测量的内容因应用程序而异。对于 Web 服务器,它可能是请求时间,对于数据库,它可能是活动连接数或活动查询数等。
metrics的作用,假设你正在运行一个 Web 应用程序并发现该应用程序很慢。你将需要一些信息来了解你的应用程序发生了什么。例如,当请求数量很高时,应用程序可能会变慢。如果你有请求计数指标,你可以找出原因并增加服务器数量来处理负载。
1.4 应用场景
Prometheus在记录纯数字时间序列方面表现非常好。既适用于面向服务器等硬件指标的监控,也适用于高动态的面向服务架构的监控。对于现在流行的微服务,Prometheus的多维度数据收集和数据筛选查询语言也是非常的强大。Prometheus是为服务的可靠性而设计的,当服务出现故障时,它可以使你快速定位和诊断问题。它的搭建过程对硬件和服务没有很强的依赖关系。
Prometheus的价值在于可靠性,甚至在很恶劣的环境下,都可以随时访问它和查看系统服务各种指标的统计信息。 如果你对统计数据需要100%的精确,它并不适用,例如:它不适用于实时计费系统。
2 Prometheus安装
2.1 windows安装
1.下载安装包:https://prometheus.io/download/
2.解压缩,.exe 运行可执行文件.
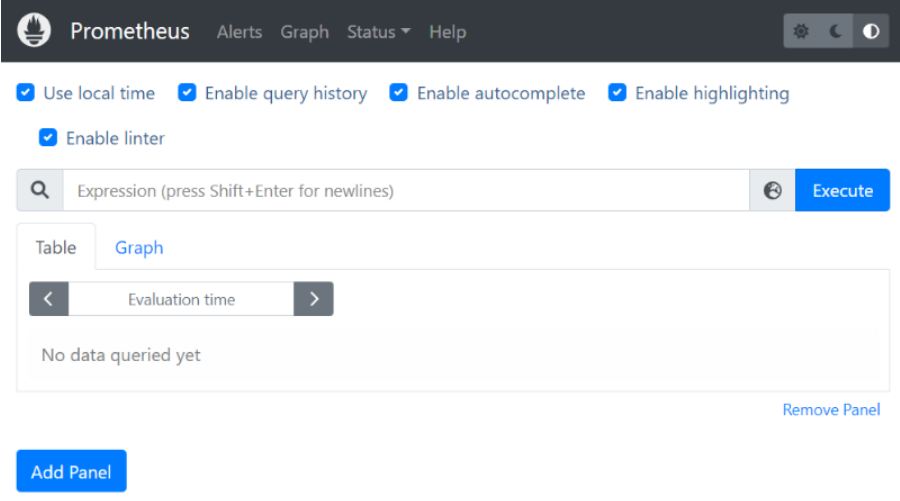
3.打开浏览器访问:http://localhost:9090/
2.2 Linux安装
环境介绍:
| 系统 | IP地址 | 配置 | 带宽 |
|---|---|---|---|
| Rock Linux 9.6 | 150.158.57.109(公网)、10.0.0.14(内网) | 4核4GB | 30M |
1.下载安装包:https://prometheus.io/download/
2.解压缩,重命名:
1.官网下载对应的Linux版本后,通过远程工具上传至服务器
2.通过wget工具下载
  wget https://github.com/prometheus/prometheus/releases/download/v3.13.2/prometheus-3.13.2.linux-amd64.tar.gz

# 解压缩
  tar -zxvf prometheus-3.13.2.linux-amd64.tar.gz

[root@k8s-node1 ~]# ls
prometheus-3.13.2.linux-amd64  prometheus-3.13.2.linux-amd64.tar.gz

# 重命名
  mv prometheus-3.13.2.linux-amd64 prometheus
[root@k8s-node1 ~]# ls
prometheus  prometheus-3.13.2.linux-amd64.tar.gz
3.移动到 /usr/local目录下面
mv prometheus /usr/local/4.启动prometheus
cd /usr/local/prometheus
nohup ./prometheus &

# 在 Linux 上放通 9090 端口,取决于用的是哪种防火墙。常用命令如下:

1. firewalld(CentOS 7+/Fedora/RHEL 7+)
   # 放通端口  参数说明:--permanent 表示永久生效,不加则重启后失效。
   sudo firewall-cmd --zone=public --add-port=9090/tcp --permanent

   # 重载生效
   sudo firewall-cmd --reload

   # 验证
   sudo firewall-cmd --list-ports

2. iptables(CentOS 6/旧系统)
   # 放通端口
   sudo iptables -I INPUT -p tcp --dport 9090 -j ACCEPT

   # 保存规则(避免重启丢失)
   sudo service iptables save                    # CentOS 6
   sudo iptables-save > /etc/iptables/rules.v4   # Debian/Ubuntu

3. ufw(Ubuntu/Debian)
   # 放通端口
   sudo ufw allow 9090/tcp

   # 查看状态
   sudo ufw status


# 检查应用本身是否在监听 9090 端口
  sudo ss -tlnp | grep 9090
5.停止prometheus
ps -ef |grep prometheus  # 找到进程号

[root@k8s-node1 prometheus]# ps -ef | grep prometheus
root     2881426 2872031  0 13:46 pts/0    00:00:02 ./prometheus
root     2887283 2872031  0 14:02 pts/0    00:00:00 grep --color=auto prometheus


kill -TERM 2881426

# 或者直接杀掉所有 prometheus 进程
sudo pkill prometheus
注意:kill -9 进程号 会强制杀进程。kill 或 kill -TERM 让进程自己执行退出程序,这样进程可以自己执行一些清理动作然后退出。
3 设置系统服务
在命令行启动停止prometheus非常繁琐,为此将prometheus配置为系统服务,实现步骤如下:
3.1 创建用户
创建 prometheus 用户并设置权限
# 创建用户(无登录权限)
sudo useradd --no-create-home --shell /bin/false prometheus

# 创建数据目录(数据会存在同级 data 目录)
sudo mkdir -p /usr/local/prometheus/data

# 设置整个 prometheus 目录权限
sudo chown -R prometheus:prometheus /usr/local/prometheus
3.2 创建服务文件
创建 systemd 服务文件
在/etc/systemd/system/文件夹下面创建prometheus.service内如如下:
注明:/usr/lib/systemd/system这个路径也可以配置服务
sudo vim /etc/systemd/system/prometheus.service
[Unit]
Description=Prometheus Monitoring System
Documentation=https://prometheus.io/docs/
After=network-online.target

[Service]
User=prometheus
Group=prometheus
Type=simple
# --storage.tsdb.path是可选项,默认数据目录在运行目录的./dada目录中
ExecStart=/usr/local/prometheus/prometheus \
  --config.file=/usr/local/prometheus/prometheus.yml \
  --storage.tsdb.path=/usr/local/prometheus/data \
  --storage.tsdb.retention.time=15d \
  --web.listen-address=0.0.0.0:9090 \
  --web.enable-lifecycle
ExecReload=/bin/kill -HUP $MAINPID
Restart=on-failure
RestartSec=5s

[Install]
WantedBy=multi-user.target
3.3 启动参数说明
--config.file– 指明prometheus的配置文件路径--web.enable-lifecycle– 指明prometheus配置更改后可以进行热加载,可用 curl -X POST localhost:9090/-/reload--storage.tsdb.path– 指明监控数据存储路径--storage.tsdb.retention.time–指明数据保留时间(15天)--web.listen-address 监听地址–0.0.0.0:9090 表示所有网卡
3.4 设置开机启动
启动 systemd 服务
# 重载 systemd 配置
sudo systemctl daemon-reload

# 启动服务并设置为开机自启
sudo systemctl enable --now prometheus

# 查看状态
sudo systemctl status prometheus

# 重启/停止
sudo systemctl restart prometheus
sudo systemctl stop prometheus
3.5 验证
# 查看端口是否监听
sudo ss -tlnp | grep 9090

# 访问 Web UI(浏览器打开)
http://150.158.57.109:9090

# 查看实时日志
sudo journalctl -u prometheus -f
3.6 后续管理 Prometheus
systemctl start/stop/restart prometheus
systemctl status prometheus 查看状态
journalctl -u prometheus -f 查看日志
3.7 热加载
在启动prometheus时加上参数 --web.enable-lifecycle , 可以启用配置的热加载, 配置修改后, 热加载配置:
curl -X POST http://localhost:9090/-/reload3.8 一键部署脚本
# 停止旧进程
sudo pkill prometheus 2>/dev/null

# 创建用户
sudo useradd --no-create-home --shell /bin/false prometheus 2>/dev/null

# 创建数据目录并授权
sudo mkdir -p /usr/local/prometheus/data
sudo chown -R prometheus:prometheus /usr/local/prometheus

# 写入 service 文件
sudo tee /etc/systemd/system/prometheus.service > /dev/null <<EOF
[Unit]
Description=Prometheus Monitoring System
Documentation=https://prometheus.io/docs/
After=network-online.target

[Service]
User=prometheus
Group=prometheus
Type=simple
ExecStart=/usr/local/prometheus/prometheus \
  --config.file=/usr/local/prometheus/prometheus.yml \
  --storage.tsdb.path=/usr/local/prometheus/data \
  --storage.tsdb.retention.time=15d \
  --web.listen-address=0.0.0.0:9090 \
  --web.enable-lifecycle
ExecReload=/bin/kill -HUP \$MAINPID
Restart=on-failure
RestartSec=5s

[Install]
WantedBy=multi-user.target
EOF

# 启动并设置开机自启
sudo systemctl daemon-reload
sudo systemctl enable --now prometheus
sudo systemctl status prometheus
4 配置文件
prometheus的安装目录下面有一个prometheus.yaml文件,该文件是prometheus的配置文件。默认配置文件内容如下:
# my global config
global:
  scrape_interval: 15s # Set the scrape interval to every 15 seconds. Default is every 1 minute.
  evaluation_interval: 15s # Evaluate rules every 15 seconds. The default is every 1 minute.
  # scrape_timeout is set to the global default (10s).

# Alertmanager configuration
alerting:
  alertmanagers:
    - static_configs:
        - targets:
          # - alertmanager:9093

# Load rules once and periodically evaluate them according to the global 'evaluation_interval'.
rule_files:
  # - "first_rules.yml"
  # - "second_rules.yml"

# A scrape configuration containing exactly one endpoint to scrape:
# Here it's Prometheus itself.
scrape_configs:
  # The job name is added as a label `job=<job_name>` to any timeseries scraped from this config.
  - job_name: "prometheus"

    # metrics_path defaults to '/metrics'
    # scheme defaults to 'http'.

    static_configs:
      - targets: ["localhost:9090"]
       # The label name is added as a label `label_name=<label_value>` to any timeseries scraped from this config.
        labels:
          app: "prometheus"
prometheus的数据采集、查询、存储和推送报警都在该配置文件中配置。
1.global: 指定的是prometheus的全局配置, 比如采集间隔,抓取超时时间等。
2.rule_files: 指定报警规则文件, prometheus根据这些规则信息,会推送报警信息到alertmanager中。
3.scrape_configs:指定抓取配置,prometheus的数据采集通过此片段配置。
4.alerting:指定报警配置, 这里主要是指定prometheus将报警规则推送到指定的alertmanager实例地址。
4.1 global全局配置
scrape_interval:抓取间隔
evaluation_interval:估算规则的默认周期 ,默认1分钟
scrape_timeout:抓取超时时间
4.2 scrapy_config抓取配置
一个scrape_config 片段指定一组目标和参数, 目标就是实例,指定采集的端点, 参数描述如何采集这些实例, 主要参数如下:
| 参数 | 说明 | 参数 | 说明 |
|---|---|---|---|
| scrape_interval | 抓取间隔,默认继承global值 | basic_auth | 指定认证信息 |
| scrape_timeout | 抓取超时时间,默认继承global值 | *_sd_configs | 指定服务发现配置 |
| metric_path | 抓取路径,默认是/metrics | static_configs | 静态指定服务job |
| scheme | 指定采集使用的协议,http或者https | relabel_config | relabel设置 |
| params | 指定url参数 |
5 使用node exporter监控主机
prometheus通过一种称为exporter的组件来收集信息,例如:收集主机信息的node exporter、收集MongoDB 信息的 MongoDB exporter 等等。Prometheus Server 从 node exporter 上拉取信息。
prometheus官网提供了这些exporter的下载:https://prometheus.io/download/
5.1 下载
下载地址:https://prometheus.io/download/
5.2 安装
将下载包解压,并将可执行文件拷贝到/usr/local/sbin/node_exporter目录下面。
1.官网下载对应的Linux版本后,通过远程工具上传至服务器
2.通过wget工具下载
  wget https://github.com/prometheus/node_exporter/releases/download/v1.12.1/node_exporter-1.12.1.linux-amd64.tar.gz

# 解压缩
  tar -zxvf node_exporter-1.12.1.linux-amd64.tar.gz

[root@k8s-node1 ~]# ls
node_exporter-1.12.1.linux-amd64  node_exporter-1.12.1.linux-amd64.tar.gz

[root@k8s-node1 ~]# cd node_exporter-1.12.1.linux-amd64/
[root@k8s-node1 node_exporter-1.12.1.linux-amd64]# ls
LICENSE  node_exporter  NOTICE
[root@k8s-node1 node_exporter-1.12.1.linux-amd64]# cp node_exporter /usr/local/sbin/
5.3 配置系统服务
创建文件 /etc/systemd/system/node-exporter.service,内容如下:
[Unit]
Description=Prometheus Node Exporter
After=network.target

[Service]
ExecStart=/usr/local/sbin/node_exporter
User=nobody

[Install]
WantedBy=multi-user.target
5.4 设置开机启动
执行下面的命令设置为开机启动并启动服务
# 重载 systemd 配置
sudo systemctl daemon-reload

# 启动服务并设置为开机自启
sudo systemctl enable --now node-exporter

# 查看状态
sudo systemctl status node-exporter

# 重启/停止
sudo systemctl restart node-exporter
sudo systemctl stop node-exporter

# node exporter 默认监听 9100 端口,检查端口监听情况
ss -tunl
sudo ss -tlnp | grep 9100
5.5 Prometheus拉取数据
配置 Prometheus 从 Node Exproter 拉取数据
Prometheus Server 可以从不同的 exporter 上拉取数据,对于上面的 node exporter 可以利用 Prometheus 的 static_configs 来拉取 node exporter 的数据。编辑 Prometheus server 的配置文件:
# 在 scrape_configs`中添加一个 名称为 node 的 `static_configs`:
vim /usr/local/prometheus/prometheus.yml
...
- job_name: "node"
  static_configs:
    - targets: ["localhost:9100"]
...
完整配置文件如下:
# my global config
global:
  scrape_interval: 15s # Set the scrape interval to every 15 seconds. Default is every 1 minute.
  evaluation_interval: 15s # Evaluate rules every 15 seconds. The default is every 1 minute.
  # scrape_timeout is set to the global default (10s).

# Alertmanager configuration
alerting:
  alertmanagers:
    - static_configs:
        - targets:
          # - alertmanager:9093

# Load rules once and periodically evaluate them according to the global 'evaluation_interval'.
rule_files:
  # - "first_rules.yml"
  # - "second_rules.yml"

# A scrape configuration containing exactly one endpoint to scrape:
# Here it's Prometheus itself.
scrape_configs:
  # The job name is added as a label `job=<job_name>` to any timeseries scraped from this config.
  - job_name: "prometheus"

    # metrics_path defaults to '/metrics'
    # scheme defaults to 'http'.

    static_configs:
      - targets: ["localhost:9090"]
       # The label name is added as a label `label_name=<label_value>` to any timeseries scraped from this config.
        labels:
          app: "prometheus"

  - job_name: "node"
    static_configs:
      - targets: ["localhost:9100"]
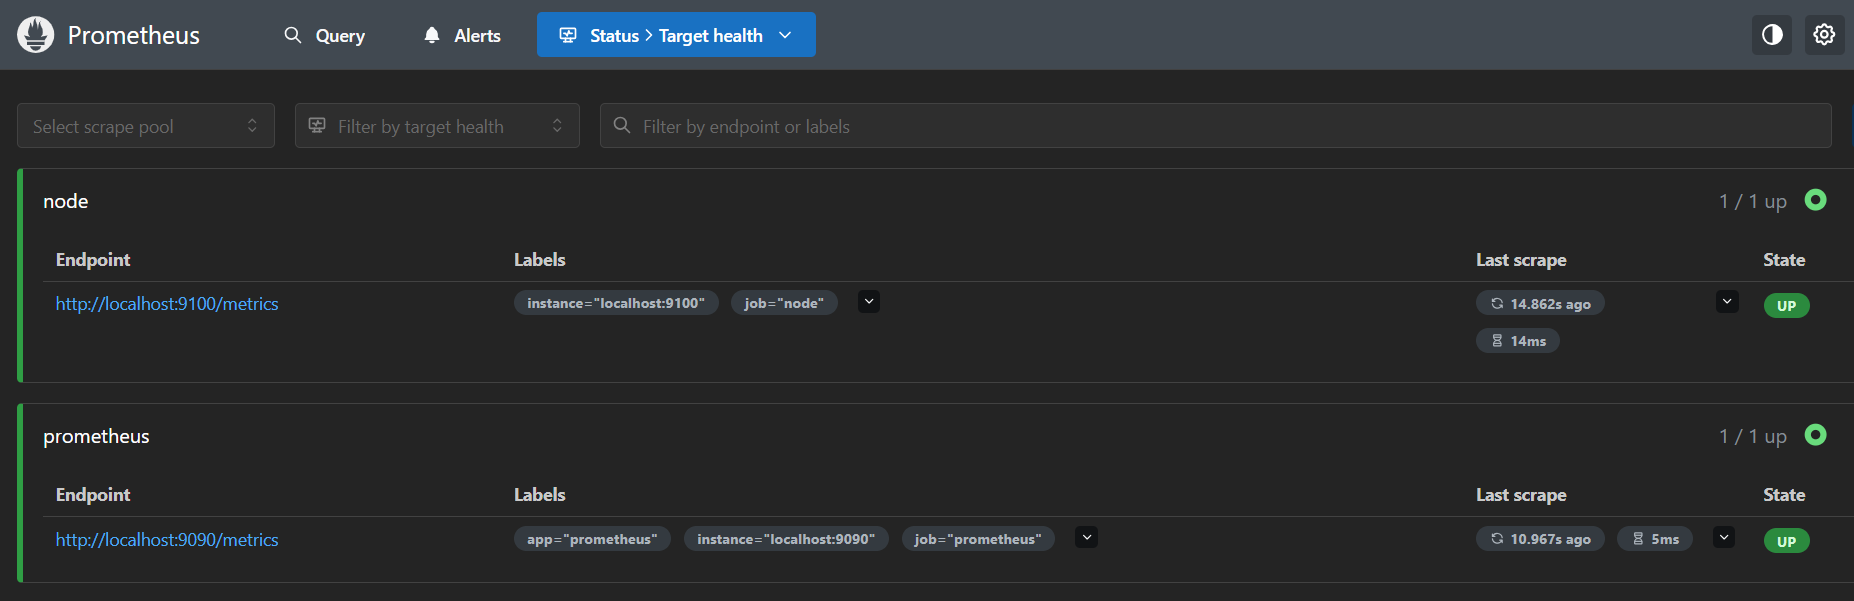
保存文件然后重启 prometheus 服务!重启后 prometheus 服务会每隔 15s 从 node exporter 上拉取一次数据。
systemctl restart prometheus打开Prometheus Server web界面,在Status菜单下面选择Targets health,如下图所示:
5.6 查询数据
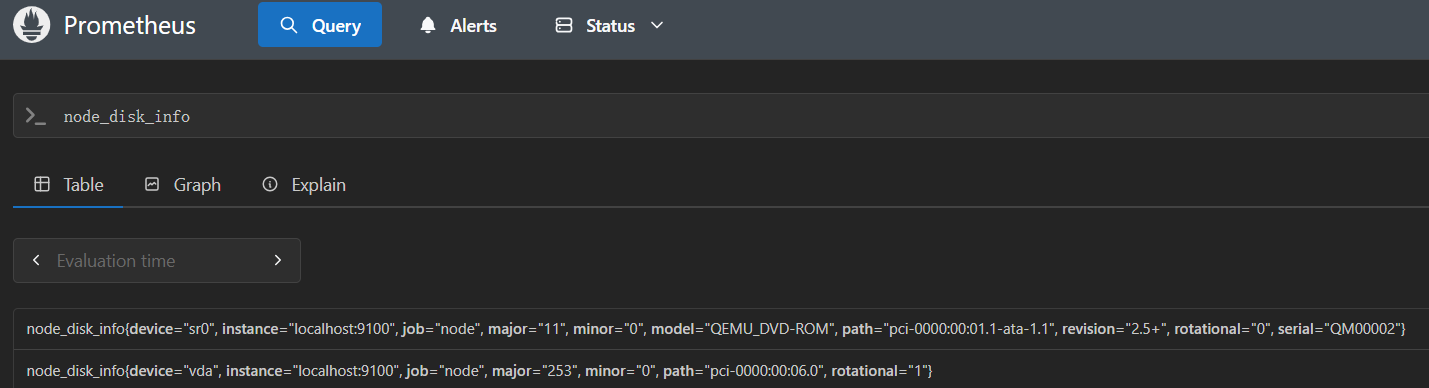
进行一次简单的查询来验证本文安装配置的系统。在浏览器中访问 Prometheus Server,选择node_disk_info查询结果如下:
6 AlertManager
prometheus的监控和报警功能是两个部分,默认是没有报警功能的,需要安装AlertManager插件才能实现报警功能。
6.1 下载AlertManager
AlertManager下载地址是:https://prometheus.io/download/
linux平台下载地址:https://github.com/prometheus/alertmanager/releases/download/v0.33.1/alertmanager-0.33.1.linux-amd64.tar.gz
6.2 安装AlertManager
将在两个节点部署AlertManager:
| 系统 | IP地址 | 配置 | 带宽 |
|---|---|---|---|
| Rock Linux 9.6 | 150.158.57.109(公网)、10.0.0.14(内网) | 4核4GB | 30M |
| Rock Linux 9.6 | 110.40.154.116(公网)、10.0.0.9(内网) | 4核4GB | 30M |
1.官网下载对应的Linux版本后,通过远程工具上传至服务器
2.通过wget工具下载
  wget https://github.com/prometheus/alertmanager/releases/download/v0.33.1/alertmanager-0.33.1.linux-amd64.tar.gz

# 解压缩AlertManager
  tar -zxvf alertmanager-0.33.1.linux-amd64.tar.gz

# 重命名
  mv alertmanager-0.33.1.linux-amd64 alertmanager

# 移动到 /usr/local 下面
  mv alertmanager /usr/local
6.3 配置AlertManager为系统服务
在/etc/systemd/system目录下面创建alertmanager.service
vim /etc/systemd/system/alertmanager.service

[Unit]
Description=Prometheus AlertManager
After=network.target

[Service]
ExecStart=/usr/local/alertmanager/alertmanager \
  --config.file=/usr/local/alertmanager/alertmanager.yml
User=root

[Install]
WantedBy=multi-user.target
6.4 设置开机启动
执行下面的命令设置为开机启动并启动服务
# 重载 systemd 配置
sudo systemctl daemon-reload

# 启动服务并设置为开机自启
sudo systemctl enable --now alertmanager

# 查看状态
sudo systemctl status alertmanager

# 重启/停止
sudo systemctl restart alertmanager
sudo systemctl stop alertmanager

# node exporter 默认监听 9093 端口,检查端口监听情况
ss -tunl
sudo ss -tlnp | grep 9093

# 在 Linux 上放通 9093 端口,取决于用的是哪种防火墙。常用命令如下:

firewalld(CentOS 7+/Fedora/RHEL 7+)
   # 放通端口  参数说明:--permanent 表示永久生效,不加则重启后失效。
   sudo firewall-cmd --zone=public --add-port=9093/tcp --permanent

   # 重载生效
   sudo firewall-cmd --reload

   # 验证
   sudo firewall-cmd --list-ports
6.4 访问AlertManager
alertmanager的监听端口是:9093,打开浏览器输入:
http://150.158.57.109:9093
http://110.40.154.116:9093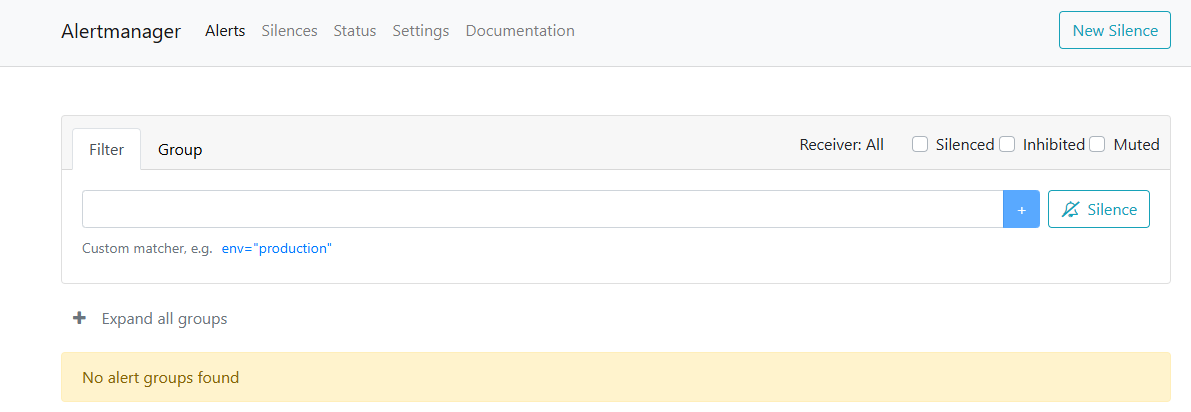
6.5 AlertManager配置
Alertmanager的配置有两个地方,一个是在Prometheus server端进行配置告警节点,指定匹配告警规则文件路径,以及监控alertmanager本身。另一个直接配置alertmanager自身的配置,在alertmanager.yml进行配置。
6.5.1 配置Prometheus server
配置1:告警推送地址,Prometheus一旦触发告警规则(rule_files里的告警规则),会把告警数据主动推送给配置的IP端口的AlertManager服务,由AlertManager去做分组、抑制、邮件或微信短信通知。
alerting:
alertmanagers:
- static_configs:
- targets:
- 110.40.154.116:9093 # 配置alertmanager节点列表
- 150.158.57.109:9093
配置2:抓取AlertManager自身监控指标,Prometheus定期去拉取Alertmanager自身运行metrics(端口9093是AleetManager默认metrics端口),用来监控AlertManager服务本身是否正常运行、告警队列数量、推送成功率等。这个是监控AlertManeger本身状态的采集任务。
scrape_configs:
…
- job_name: “alertmanager” # 指定监控任务alertmanager
static_configs:- targets: [“150.158.57.109:9093”]
- targets: [“110.40.154.116:9093”]
[root@k8s-node1 ~]# vim /usr/local/prometheus/prometheus.yml
...
# Alertmanager configuration
alerting:
  alertmanagers:
    - static_configs:
        - targets:
            - 110.40.154.116:9093  # 配置alertmanager节点列表
            - 150.158.57.109:9093

# Load rules once and periodically evaluate them according to the global 'evaluation_interval'.
rule_files:
  # - "first_rules.yml"
  # - "second_rules.yml"

# A scrape configuration containing exactly one endpoint to scrape:
# Here it's Prometheus itself.
scrape_configs:
...
  - job_name: "alertmanager"   # 指定监控任务alertmanager
    static_configs:
      - targets: ["150.158.57.109:9093"]
      - targets: ["110.40.154.116:9093"]
完整配置如下:
# my global config
global:
  scrape_interval: 15s # Set the scrape interval to every 15 seconds. Default is every 1 minute.
  evaluation_interval: 15s # Evaluate rules every 15 seconds. The default is every 1 minute.
  # scrape_timeout is set to the global default (10s).

# Alertmanager configuration
alerting:
  alertmanagers:
    - static_configs:
        - targets:
            - 110.40.154.116:9093  # 配置alertmanager节点列表
            - 150.158.57.109:9093

# Load rules once and periodically evaluate them according to the global 'evaluation_interval'.
rule_files:
  # - "first_rules.yml"
  # - "second_rules.yml"

# A scrape configuration containing exactly one endpoint to scrape:
# Here it's Prometheus itself.
scrape_configs:
  # The job name is added as a label `job=<job_name>` to any timeseries scraped from this config.
  - job_name: "prometheus"

    # metrics_path defaults to '/metrics'
    # scheme defaults to 'http'.

    static_configs:
      - targets: ["localhost:9090"]
       # The label name is added as a label `label_name=<label_value>` to any timeseries scraped from this config.
        labels:
          app: "prometheus"

  - job_name: "node"
    static_configs:
      - targets: ["localhost:9100"]

  - job_name: "alertmanager"   # 指定监控任务alertmanager
    static_configs:
      - targets: ["150.158.57.109:9093"]
      - targets: ["110.40.154.116:9093"]
添加完成后,在prometheus server的web端可以查看到alertmanager的targets列表,如下:
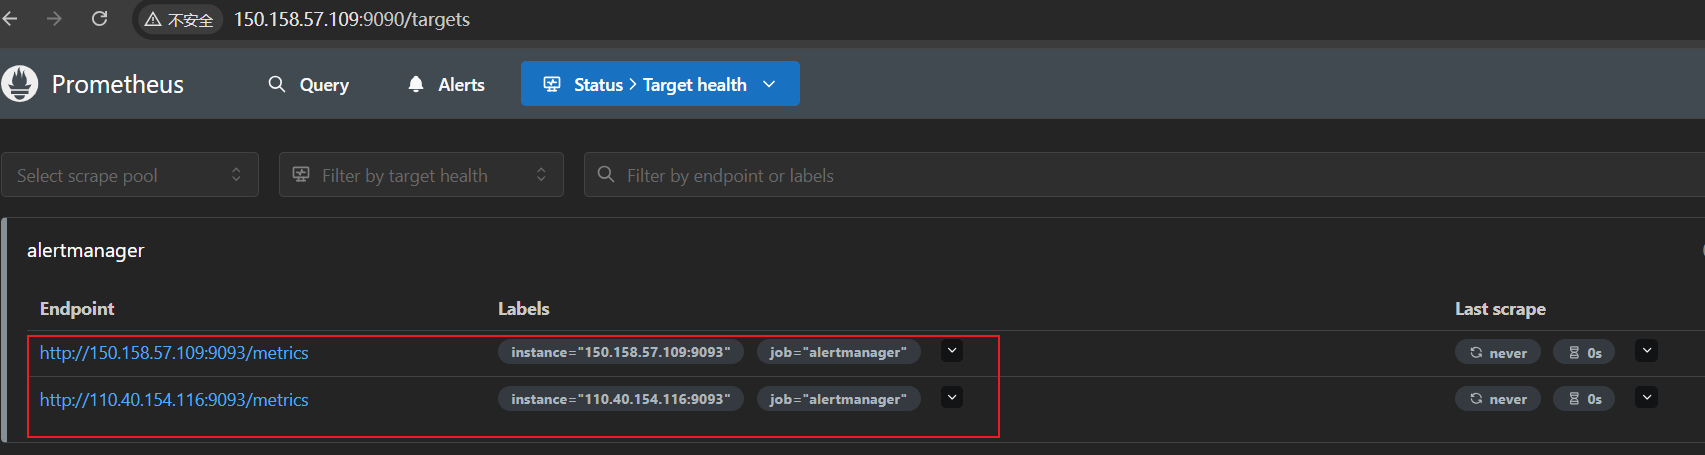
配置完成prometheus.yml后,再来看看默认的alertmanager.yml,如下:
vim /usr/local/alertmanager/alertmanager.yml
global:
  resolve_timeout: 5m    #处理超时时间,默认为5min

route:
  group_by: ['alertname']    # 报警分组依据
  group_wait: 10s    # 最初即第一次等待多久时间发送一组警报的通知
  group_interval: 10s    # 在发送新警报前的等待时间
  repeat_interval: 1h    # 发送重复警报的周期 对于email配置中,此项不可以设置过低,否则将会由于邮件发送太多频繁,被smtp服务器拒绝
  receiver: 'web.hook'    # 发送警报的接收者的名称,以下receivers name的名称

receivers:
- name: 'web.hook'    # 警报
  webhook_configs:    # webhook配置
  - url: 'http://127.0.0.1:5001/'   # 也可以写本机的IP地址

# 一个inhibition规则是在与另一组匹配器匹配的警报存在的条件下,使匹配一组匹配器的警报失效的规则。两个警报必须具有一组相同的标签。
inhibit_rules:
  - source_matchers: [severity="critical"]
    target_matchers: [severity="warning"]
    # Apply inhibition if the alertname is the same.
    # CAUTION:
    #   If all label names listed in `equal` are missing
    #   from both the source and target alerts,
    #   the inhibition rule will apply!
equal: [alertname, dev, instance]global: 全局配置,包括报警解决后的超时时间、SMTP 相关配置、各种渠道通知的 API 地址等等。
route: 用来设置报警的分发策略,它是一个树状结构,按照深度优先从左向右的顺序进行匹配。
receivers: 配置告警消息接受者信息,例如常用的 email、wechat、slack、webhook 等消息通知方式。
inhibit_rules: 抑制规则配置,当存在与另一组匹配的警报(源)时,抑制规则将禁用与一组匹配的警报(目标)。
6.5.2 AlertManager实现报警
1.创建规则文件
1.在prometheus的安装目录中创建文件夹rules
  [root@k8s-node1 ~]# cd /usr/local/prometheus/
  [root@k8s-node1 prometheus]# mkdir rules

2.在该文件夹中创建`node_rules.yml`规则文件
groups:
- name: node-up    # 分组名称
  rules:           # 规则设置
  - alert: node-up  #告警名称
    expr: up{job="node"} == 0    # 表达式,查询式语句查询up的值是否等于0,如果等于则告警
    for: 15s    # 告警持续时间
    labels:
      severity: 1
      team: node
    annotations:    # 注解
      summary: "{{ $labels.instance }} 已停止运行超过 15s!"
2.配置alertmanager的告警信息
vim alertmanager.yml配置内容如下:
global:
  resolve_timeout: 5m
  smtp_smarthost: 'smtp.qq.com:465'
  smtp_from: '252414302@qq.com'
  smtp_auth_username: '252414302@qq.com'
  smtp_auth_password: 'hotvdzhvcqptcaha'    # 16位qq邮箱授权码作为密码
  smtp_require_tls: false
  # 报警后,发送邮件
route:
  group_by: ['alertname']
  group_wait: 10s
  group_interval: 10s
  repeat_interval: 1h
  receiver: 'email'    # 选用邮箱告警发送

receivers:
- name: 'email'
  email_configs:
  - to: '252414302@qq.com'

inhibit_rules:
  - source_match:
      severity: 'critical'
    target_match:
      severity: 'warning'
    equal: ['alertname', 'dev', 'instance']
3.修改配置Prometheus server配置文件
[root@k8s-node1 ~]# vim /usr/local/prometheus/prometheus.yml
...
# Load rules once and periodically evaluate them according to the global 'evaluation_interval'.
rule_files:
- "rules/node_rules.yml"
  # - "second_rules.yml"
...
4.测试报警
配置完成后重启prometheus服务和alertmanager服务
systemctl restart prometheus
systemctl restart alertmanager
通知node-exporter服务
systemctl stop node-exporter打开prometheus web监控界面查看报警信息
http://150.158.57.109:9090/alerts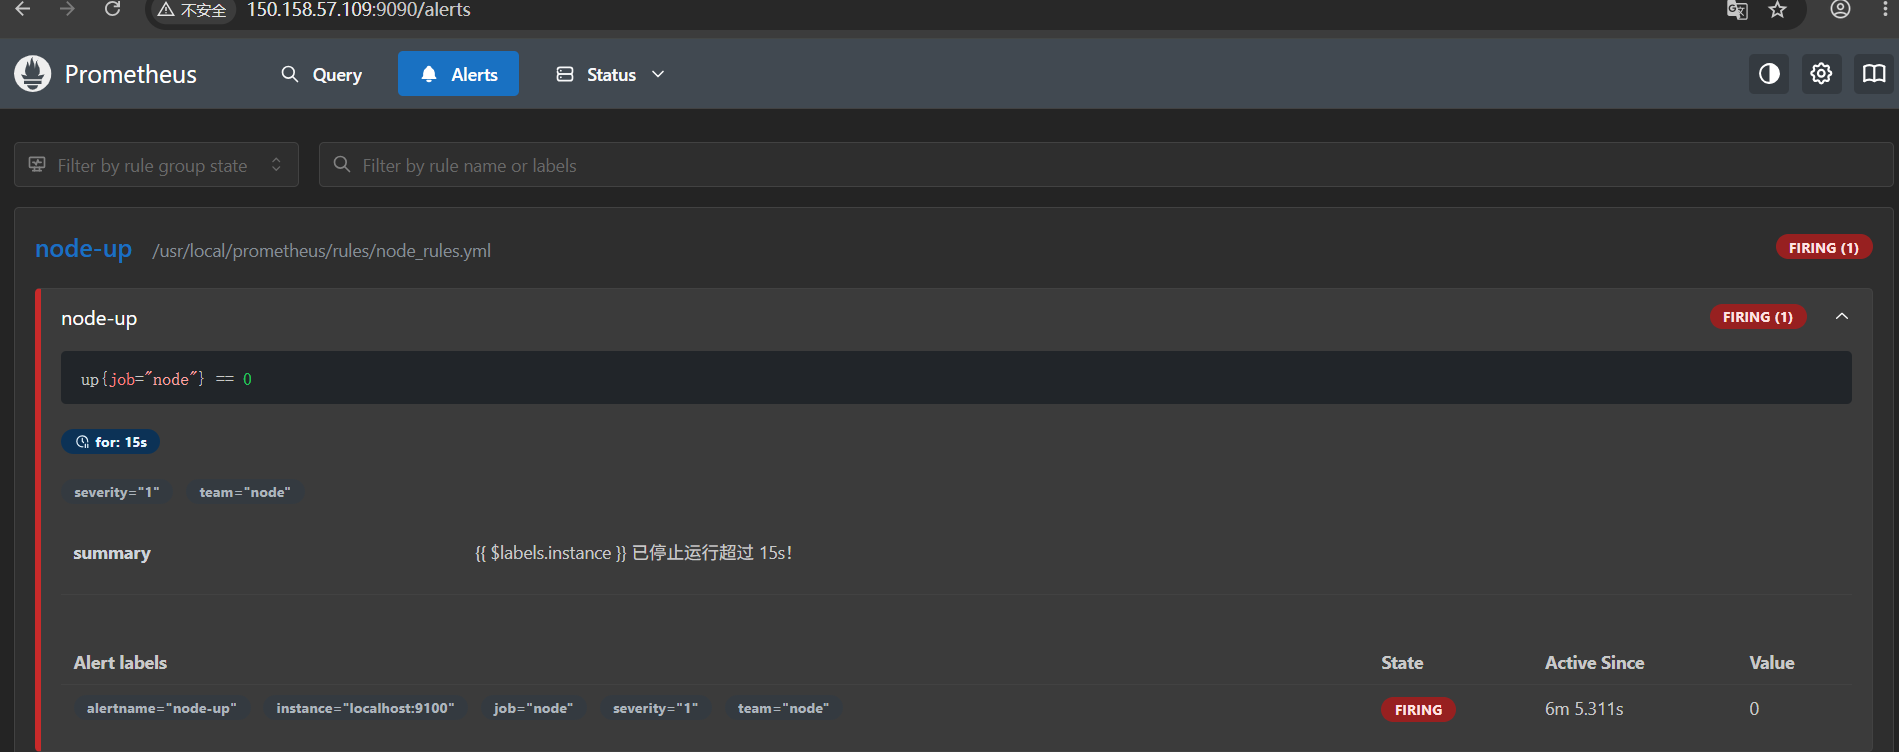
6.5.3 AlertManager自定义模板
1.创建模板文件
在alertmanager的安装目录下面创建template文件夹
1.在prometheus的安装目录中创建文件夹rules
  [root@k8s-node1 ~]# cd /usr/local/prometheus/
  [root@k8s-node1 prometheus]# mkdir template

2.在该文件夹中创建`email.tmpl`文件
{{ define "email.html" }}
    {{ range .Alerts }}
<pre>
    ========start==========
    告警程序: prometheus_alert
    告警级别: {{ .Labels.severity }}
    告警类型: {{ .Labels.alertname }}
    故障主机: {{ .Labels.instance }}
    告警主题: {{ .Annotations.summary }}
    告警详情: {{ .Annotations.description }}
    触发时间: {{ .StartsAt.Format "2019-12-14 16:01:01" }}
    ========end==========
</pre>
    {{ end }}
{{ end }} 2.修改alertmanager.yml配置
vim alertmanager.yml内容如下:
global:
  resolve_timeout: 5m
  smtp_smarthost: 'smtp.qq.com:465'
  smtp_from: '252414302@qq.com'
  smtp_auth_username: '252414302@qq.com'
  smtp_auth_password: 'hotvdzhvcqptcaha'    # 16位qq邮箱授权码作为密码
  smtp_require_tls: false

templates:    # 指定邮件模板的路径,可以使用相对路径,template/*.tmpl的方式
  - '/usr/local/alertmanager/template/email.tmpl'
route:
  group_by: ['alertname']
  group_wait: 10s
  group_interval: 10s
  repeat_interval: 1h
  receiver: 'email'    # 选用邮箱告警发送

receivers:
- name: 'email'
  email_configs:
  - send_resolved: true
    to: '252414302@qq.com'
    html: '{{ template "email.html" . }}'    # 指定使用模板,如果不指定,还是会加载默认的模板的
    headers: { Subject: "[WARN]Prometheus告警邮件" }    # 配置邮件主题

inhibit_rules:
  - source_match:
      severity: 'critical'
    target_match:
      severity: 'warning'
    equal: ['alertname', 'dev', 'instance']
3.测试
配置完成后重启prometheus服务和alertmanager服务
systemctl restart prometheus
systemctl restart alertmanager
停止node-exporter服务
systemctl stop node-exporter查看收到的邮件信息格式。
7 使用Grafana实现可视化
7.1 Grafana简介
grafana一般和时间序列数据库进行配合来展示数据的,例如:Graphite、OpenTSDB、InfluxDB、Prometheus等。
1.grafana是用于可视化大型测量数据的开源程序,他提供了强大和优雅的方式去创建、共享、浏览数据。dashboard中显示了你不同metric数据源中的数据。
2.grafana最常用于因特网基础设施和应用分析,但在其他领域也有机会用到,比如:工业传感器、家庭自动化、过程控制等等。
3.grafana有热插拔控制面板和可扩展的数据源,目前已经支持Graphite、InfluxDB、OpenTSDB、Elasticsearch、Prometheus。
Grafana支持查询Prometheus。从Grafana 2.5.0(2015-10-28)开始包含Prometheus的Grafana数据源。
7.2 Grafana安装和启动
# 安装
wget https://dl.grafana.com/enterprise/release/grafana-enterprise-9.2.4-1.x86_64.rpm
sudo yum install grafana-enterprise-9.2.4-1.x86_64.rpm

# 启动服务并设置为开机自启
sudo systemctl enable --now grafana-server

# 查看状态
sudo systemctl status grafana-server

# 重启/停止
sudo systemctl restart grafana-server
sudo systemctl stop grafana-server

# node exporter 默认监听 3000 端口,检查端口监听情况
ss -tunl
sudo ss -tlnp | grep 3000


# 在 Linux 上放通 3000 端口,取决于用的是哪种防火墙。常用命令如下:

   firewalld(CentOS 7+/Fedora/RHEL 7+)
   # 放通端口  参数说明:--permanent 表示永久生效,不加则重启后失效。
   sudo firewall-cmd --zone=public --add-port=3000/tcp --permanent

   # 重载生效
   sudo firewall-cmd --reload

   # 验证
   sudo firewall-cmd --list-ports
7.3 访问Grafana
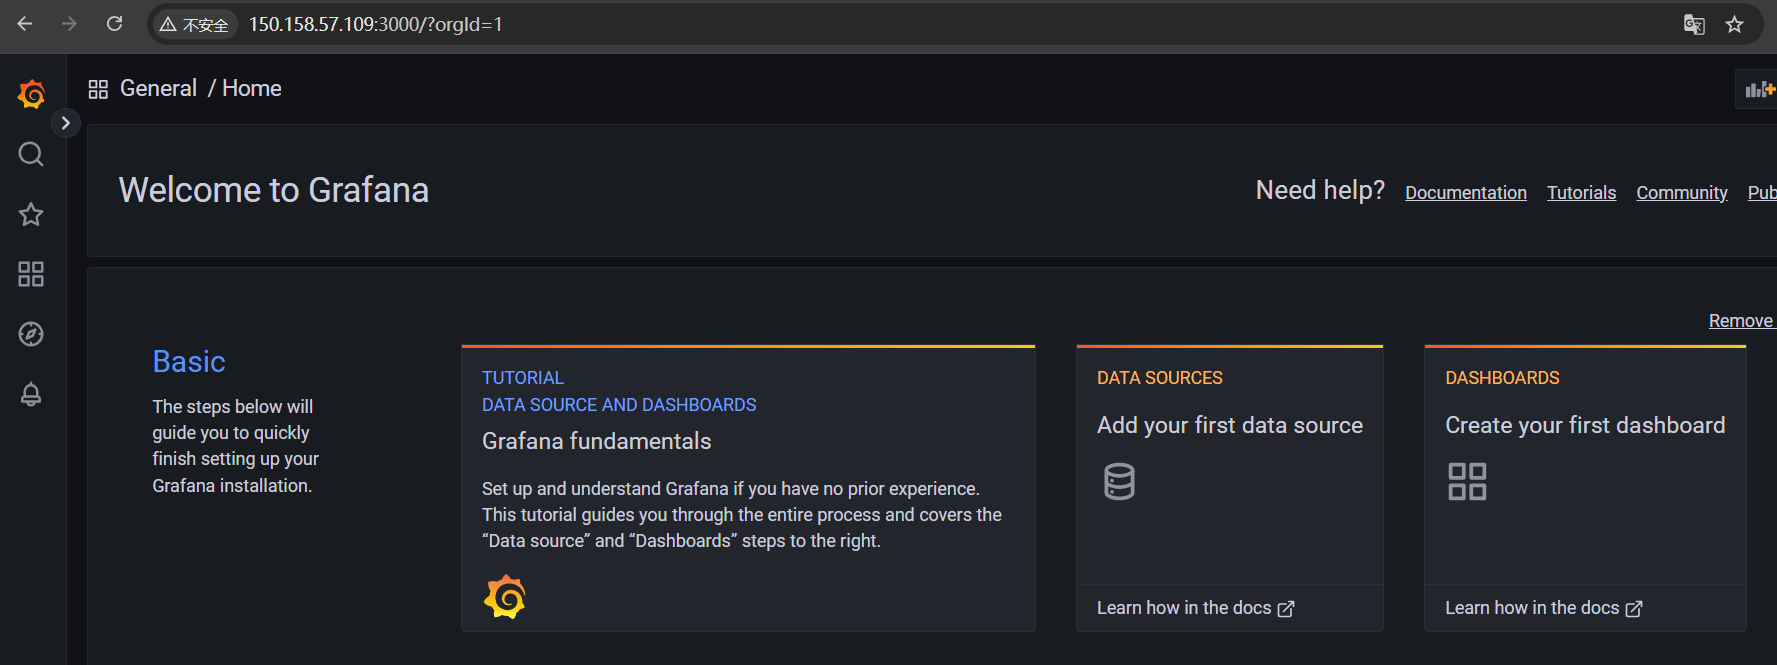
默认情况下,Grafana将在3000端口上监听 。默认登录名是admin/admin,首次登陆提示修改密码,可以skip(跳过)。
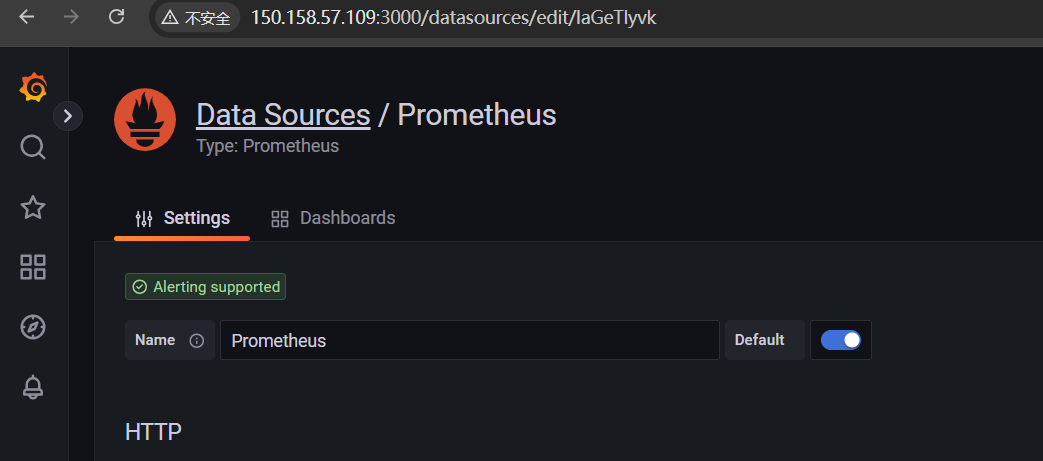
7.4 添加 Prometheus 数据源
7.4.1 进入数据源配置
1.登录 Grafana
2.点击左侧菜单的齿轮图标(Configuration)
3.选择 “Data Sources”
4.点击 “Add data source”
5.选择 “Prometheus”
7.4.2 配置 Prometheus 连接
在配置页面填写以下信息:
# 基本配置
Name: Prometheus(或自定义名称)
URL: http://localhost:9090  # Prometheus服务地址

# 可选配置
Access: Server (default)  # 通过Grafana后端代理访问
Scrape interval: 15s      # 抓取间隔
Query timeout: 60s        # 查询超时
测试连接:点击页面底部的 “Save & Test” 按钮,看到绿色的”Data source is working”提示即表示连接成功。
7.5 创建仪表板
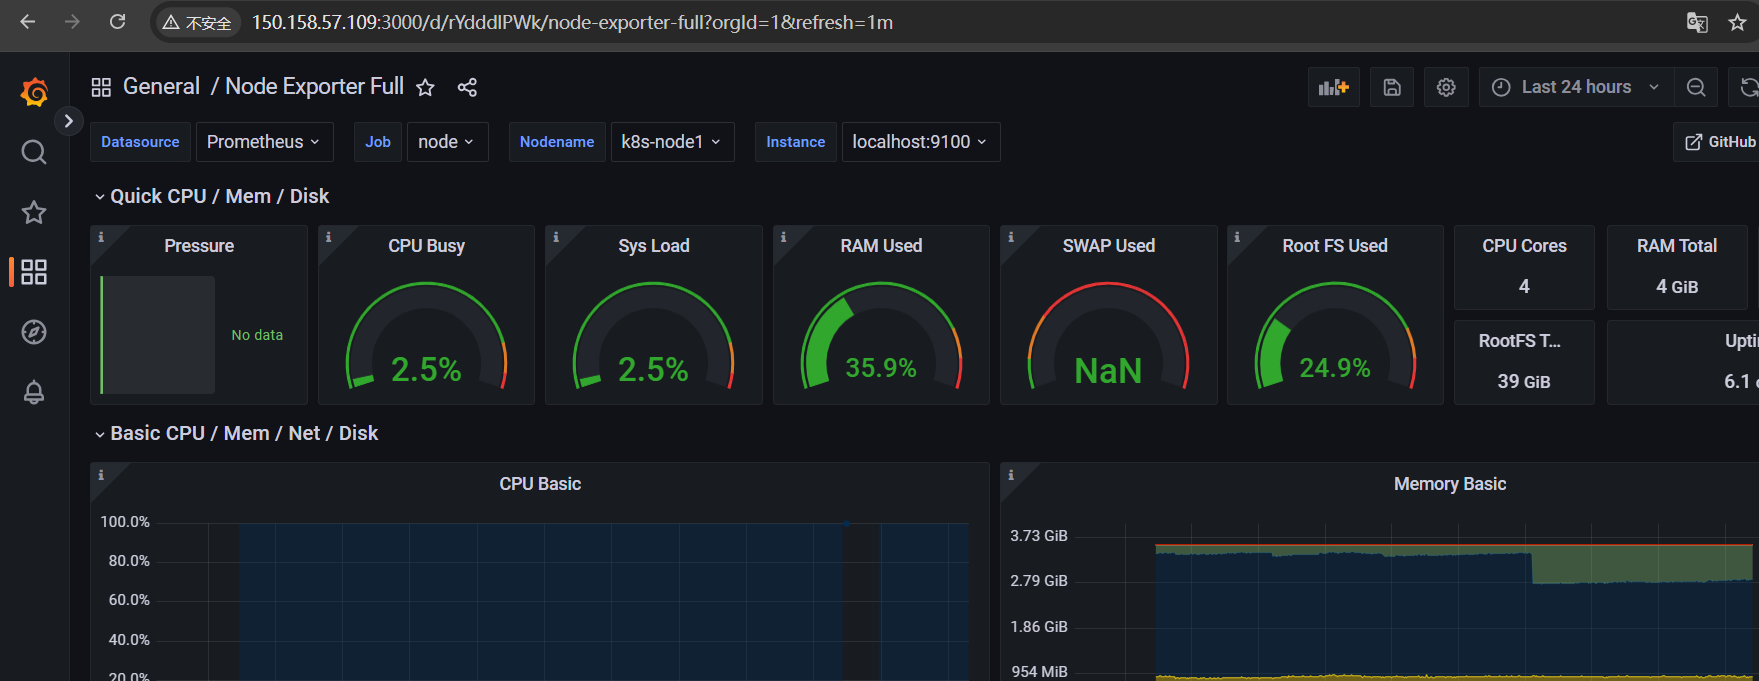
7.5.1 导入现成的仪表板
1.点击左侧 “+” 图标,选择 “Import”
2.输入仪表板ID(如 Node Exporter 的 1860)
3.选择刚才配置的 Prometheus 数据源
4.点击 “Import”
常用仪表板ID:
- 1860 - Node Exporter Full(主机监控)
- 11074 - Node Exporter for Prometheus Dashboard
- 7587 - Kubernetes cluster monitoring
- 315 - Docker monitoring
7.5.2 手动创建仪表板
1.点击左侧 “+” → “Dashboard”
2.点击 “Add new panel”
3.在查询编辑器输入 PromQL 查询:
# 示例:查询CPU使用率
100 - (avg(rate(node_cpu_seconds_total{mode="idle"}[5m])) * 100)

# 示例:查询内存使用率
(1 - (node_memory_MemAvailable_bytes / node_memory_MemTotal_bytes)) * 100

# 示例:查询磁盘使用率
100 - ((node_filesystem_avail_bytes{mountpoint="/"} * 100) / node_filesystem_size_bytes{mountpoint="/"})
4.选择合适的可视化类型(Graph、Gauge、Stat等)
5.点击 “Apply” 保存面板
7.6 高级配置
7.6.1 配置变量(模板变量)
创建可复用的仪表板变量:
1.进入仪表板设置 → Variables → Add variable
2.配置示例:
Name: instance
Type: Query
Label: Instance
Data source: Prometheus
Query: label_values(node_cpu_seconds_total, instance)
Multi-value: true
Include All option: true
7.6.2 配置告警
1.编辑面板 → Alert tab
2.创建告警规则:
Rule name: High CPU Usage
Evaluate every: 1m
For: 5m

Conditions:
WHEN avg() OF query(A, 5m, now) IS ABOVE 80

# A查询示例
A: 100 - (avg(rate(node_cpu_seconds_total{mode="idle"}[5m])) * 100)
3.配置通知渠道(Alerting → Notification channels)
7.6.3 Grafana配置文件优化
编辑 /etc/grafana/grafana.ini:
[server]
protocol = http
http_port = 3000
domain = your-domain.com

[auth.anonymous]
enabled = false

[security]
admin_user = admin
admin_password = your-secure-password

[smtp]
enabled = true
host = smtp.example.com:587
user = alert@example.com
password = your-password
from_address = grafana@example.com
8 常用 PromQL 查询示例
# CPU使用率(5分钟平均)
100 - (avg(rate(node_cpu_seconds_total{mode="idle"}[5m])) * 100)

# 内存使用百分比
(1 - (node_memory_MemAvailable_bytes / node_memory_MemTotal_bytes)) * 100

# 磁盘使用率
(node_filesystem_size_bytes{fstype!="tmpfs"} - node_filesystem_free_bytes{fstype!="tmpfs"}) / node_filesystem_size_bytes{fstype!="tmpfs"} * 100

# 网络流量
rate(node_network_receive_bytes_total[5m])

# 系统负载
node_load1

# HTTP请求速率
rate(http_requests_total[5m])
9 故障排查
# 检查Grafana日志
sudo tail -f /var/log/grafana/grafana.log

# 检查连接性
curl http://localhost:9090/api/v1/query?query=up

# 确保Prometheus允许跨域(如果需要)
# 在prometheus.yml中添加:
--web.cors.origin="http://localhost:3000"